Showing posts with label Smarter Science. Show all posts

Saturday, February 11, 2012

P.E.O.P. -- How many drops of water can sit on a face of a penny?


One of the discrepant events that works well with Smarter Science’s Predict – Explain – Observe – Explain (P.E.O.P) templates is “How many drops of water can sit on the face of a penny?” This activity is simple to set up; all you need is some pennies, medicine droppers and water. The unexpected results will lead to endless fascination, excellent questions, numerous investigations, opportunities to record, plan, design, gather data and experiment as well as  interpretation by comparing, contrasting, analyzing, evaluating, and the communication skills of discussing, explaining, reflecting and reporting.
My grade nine applied science class performed a P.E.O.P. such as this as part of their Culminating Performance Task (CPT) this past semester. The students were given one Canadian penny, a medicine dropper and the P.E.O.P. template at the introduction of the activity. This allowed all the visual learners to see just what size the dropper and the penny were prior making their predictions.
Students were instructed to make their predictions using an “If . . .then . . “ statement in box one of the template and to include a diagram. Predictions ranged from 2 to 8 drops with the mean being 4 drops of water.
In box two of the template they were to explain why they had made their predictions. Most of them wrote something along the lines that “pennies are small so not much water would fit on them”. In my class of 19 students there were neither outstanding or startling predictions nor explanations.
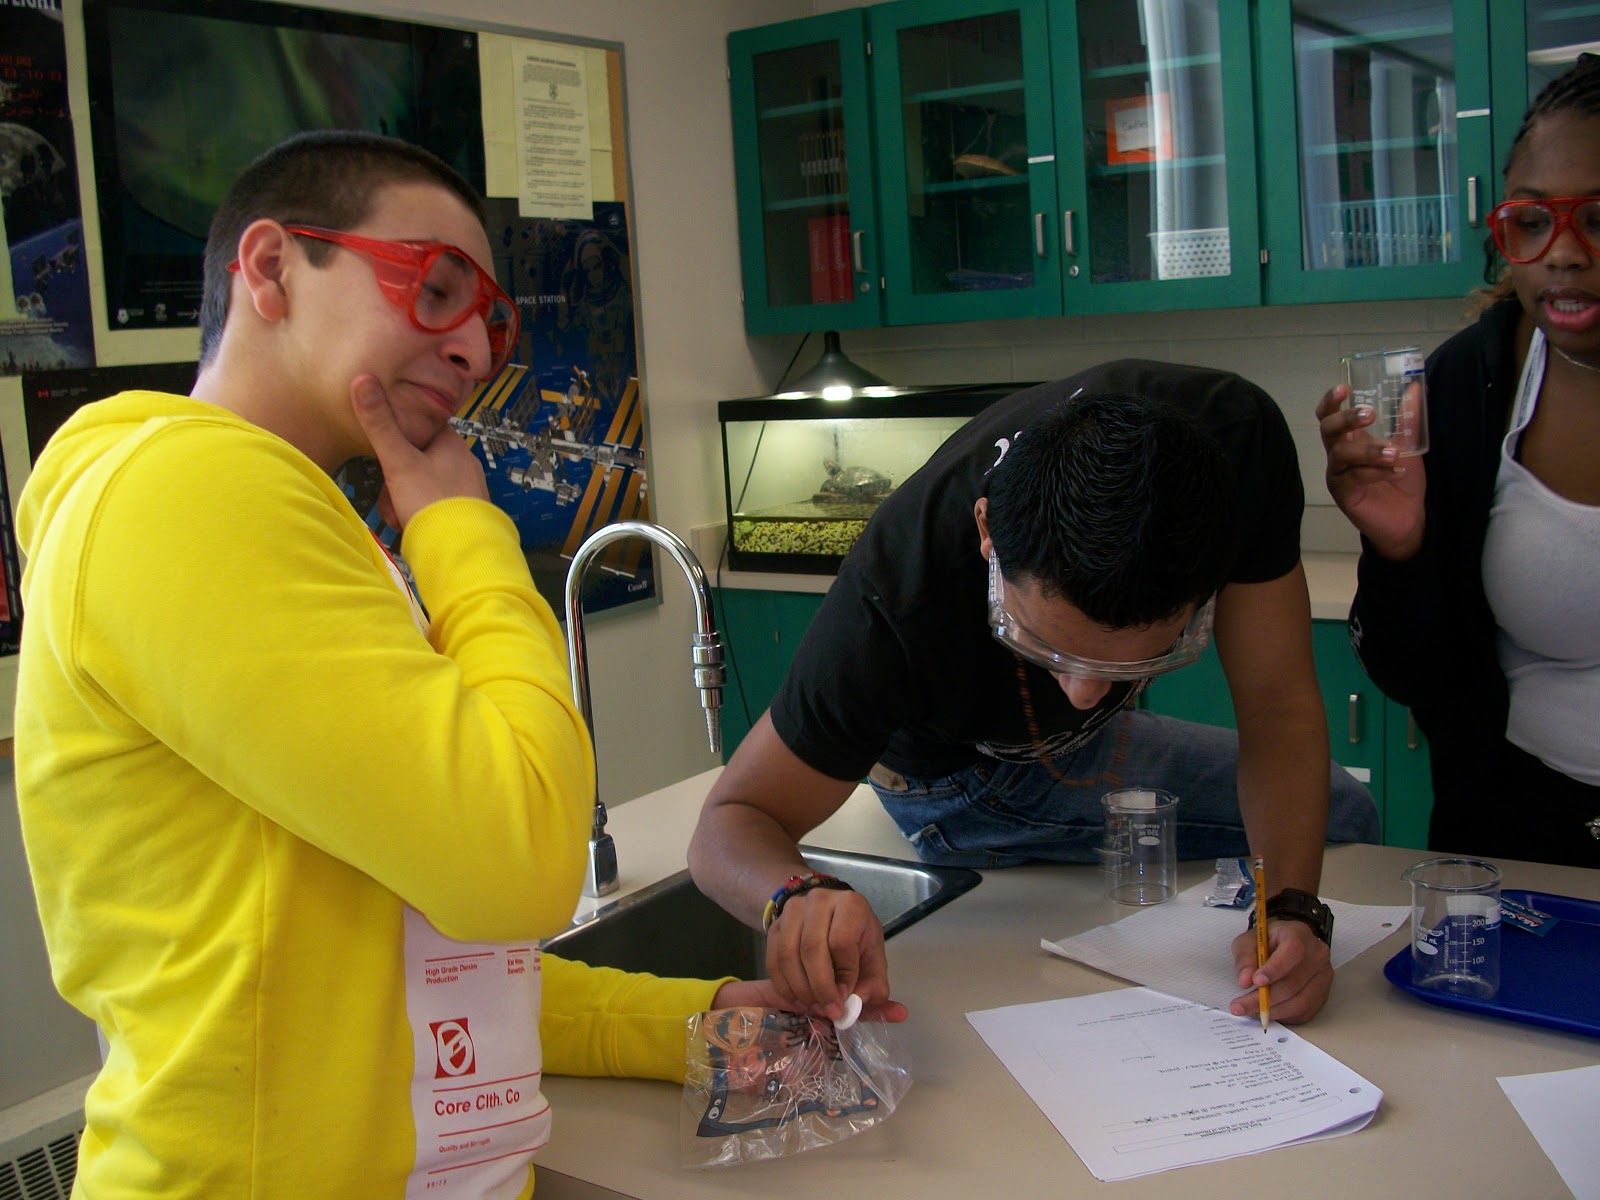
After completing box one and two of the template the students then got beakers of water and began their experiment. This may have been the only moment of time, during the entire semester, that my classroom was silent! The students were intent on this task, it thoroughly captivated them. Quite frankly they couldn’t believe what they were observing! They wanted to repeat it over and over again to ensure that their results were indeed reproducible, just like “real” scientists! Eventually, yet begrudgingly, I had them stop their experimentation so they could complete their written work and thereby provide me with documentation towards their final mark. 
In box three of the template the students recorded how many drops of water they were able to fit on the face of a penny, incredibly the highest number was 54! Although each and every student had disproved their initial prediction they were proud of their accomplishment and insightful in explaining their reasoning into why their predictions were wrong.
This simple P.E.O.P. allowed my students to not only engage in a rich, authentic task but it also allowed them to demonstrate their critical thinking skills while demonstrating how they have evolved into real scientists over the semester, not only in the all of their actions that are described above but also in the fact that they are no longer discouraged when their initial hypotheses is wrong, an outcome I had despaired of achieving!


Sunday, February 5, 2012

How does particle size affect the rate of dissolving? -- An Student Designed Inquiry


 As part of the Culminating Performance Task my grade nine applied science class used the Smarter Science emergent scientist templates (poster set three) to design and conduct an inquiry into the effect of particle size on the rate of dissolving. The solute we dissolved was store bought Alka-Seltzer tablets and the solvent we used was water.
Due to the nature of the learners in my class I assumed that some of them would have no prior knowledge of Alka-Seltzer. So I started the class by showing them the box I had purchased from the drug store, then I opened the box and showed them the packages within and finally I opened the packages and showed them the tablets. Next I showed them Alka-Selters advertisements from Youtube then I dropped one of the tablets into a beaker of water and demonstrated how to time the dissolving process from beginning (initial time) to end (final time). 
While demonstrating the last step I invited the students to pull out their digital devices and use the timers on them to help with the timing. This step allowed the students to become familiar with the timing devices they didn’t even know they had, as well as become aware of the importance of starting and stopping the timer at precisely the right moment in order to record accurate results. Because I had a limited number of tablets available and an even more limited budget with which to purchase more I wanted to ensure that no tablets would be wasted during the actual lab due to failure to record the dissolving time. 
Using the Smarter Science template the students determined that the independent variable for their investigation would be the particle size while the dependent variable would be time (rate). The controlled variables would be:
1.      Size of beaker
2.      Volume of water
3.      Temperature of water
4.      Mass of tablet (predetermined by pharmaceutical company)
5.      Timing device
Each group was given four tablets for their investigations. The particle sizes they would experiment with were:
1.      Whole tablet
2.      Whole tablet broken into halves
3.      Whole tablet broken into quarters
4.      Whole tablet crushed
Each group decided what values to give to their controlled variables and recorded them on the Smarter Science template. Once everything was planned and recorded in an intelligible fashion the students were given their four tablets and got down to some serious science.
This lab worked very well. After performing and recording the investigation the students cleaned up, washed their hands and began analyzing their results. Because most of these students are visual learners I had them use their data to construct a line graph. The results were universal, the crushed tablet dissolved at a much greater rate than any of the other formats. In their written report the students reflected how this knowledge could be used in their daily life. Most have decided to chew their prescribed tablets in the future instead of swallowing them whole. 
 
What labs have your students designed and conducted to investigate the effects of particle size on the rate of dissolving?
Can you recommend any less expensive solutes?

Friday, December 30, 2011

Modelling Expansion of the Universe – blog post #48

Teaching The Big Bang Theory to Ontario grade nine science students forces a teacher to embrace their sense of humour. First one must address the prior knowledge the students have which is: The Big Bang Theory is a television show. All good teachers know that they need to meet their students where they are and I had anticipated that my students would be familiar with this tv show so I printed out the lyrics for the theme song before class. The students were happy to sing it; following the bouncing ball on the smart board is always a fun activity!
Eventually we got into the fact that there is actually a theory about how the universe was formed and it is the Big Bang Theory. (It all started with a big bang!) My students were amazed by even this little snippet of information! As I explained the Big Bang Theory to them with the help of numerous visuals and video clips, while constantly referring back to both the lyrics and what they had learned in the chemistry unit, their engagement was obvious by the questions that came pouring out of them. My favourite was: “Why didn’t anyone ever tell me about this before?”
After spending an entire period on the Big Bang Theory I left the class with the thought that the universe is expanding and the promise that tomorrow would be a hands-on activity where we would explore this phenomena. In order to organize a hands-on activity that models how the universe is expanding to students with weak mathematical skills I used my best friend, the internet, to help me come up with a great idea! (This activity is not original to me, it is found on many web pages, I was unable to track down its origin.)
1.      Initiate and Plan = Engage

Together the class used the Smarter Science template to design a testable question. It was: “Can we model how the universe is expanding?”
The variables were:
Independent - Amount of air in the balloon
Dependent - distance between the points
Controlled - shape of balloon and keeping balloon tightly sealed during measuring
In small groups, the students were given a new balloon and a marker. Each group marked six random points onto their balloon. One was labelled home while the other five were labelled A, B, C, D and E in no particular order. 
Using a string to measure the distance between two points

Using a ruler to measure the string


Teamwork!
The surface of the balloon represented a 2-dimensional universe. Each point represented a galaxy with home being the Milky Way.
Each individual then made a hypothesis regarding what would happen to the distance from home to each of the other galaxies if the universe expanded. 

2.      Perform and Record = Explore

Recoding the data
They students measured and recorded the distance from home to each of the other five points. This measurement was taken at time one. We used this data sheet. 
An assigned group member then inflated the balloon to about the size of a grapefruit. This represented time two. The distance from home to each of the five points was measured again, while the air in the balloon was sealed inside.
This procedure of blowing more air into the balloon and measuring the distances was repeated six times and the data was collected in an observation table. 

3.      Analyze and Interpret = Explain
The students graphed their data in a simple line graph of time versus Distance from home point. They used a different colour for each line on the graph and a key to define each line.

4.      Communicate = Extend
In their final report the students had three questions to discuss. They were:
1.      How did the distance from the home dot to each of the other galaxies change each time you inflated the balloon?
2.      Did the galaxies near home or those farther away appear to move the greatest distance?
3.      How could you use this model to simulate the Big Crunch, a time when all the galaxies might collapse in on themselves?

This activity was very successful. It helped students who are not destined to be rocket scientists of astronomers understand our concept of an expanding universe. Although they used simple mathematics, measuring and line graphing, it helped them understand why I am always telling them that a lot of what we know about space has been proved mathematically.
I recommend this activity for hands-on learners of all ages!


Sunday, November 20, 2011

Using Molecular Modelling Kits to Predict, Explain, Observe, Explain the Relationship between Chemical Formulas and Molecular Shapes – Post #43


 In my grade nine applied science class the students are typically very good at both interpreting a chemical formula and in building molecular models, using the tradition ball and stick kits. However, when it comes to the higher order thinking required to add or subtract an atom from a molecular compound they are not able to visualize how the molecular shape is changed. This semester I decided to use the Predict, Explain Observe, Explain (P.E.O.E.) model that is encouraged by Smarter Science to help the students move forward in their thinking.

Prior to performing this activity the students were taught how to deconstruct a chemical formula. That is, they could articulate that H2O (water) was a molecule composed of two hydrogen and one oxygen atom whereas H2O2 (hydrogen peroxide) was a molecule made up of two hydrogen and two oxygen atoms. Although the students were familiar with the Periodic Table and knew that families or groups represented the vertical columns and atoms in the same family shared chemical and physical properties they were unable to interpret the number of valence electrons each atom has and how this influenced chemical bonding.
1.      Initiate and Plan
To engage the students in this activity I began by distributing the molecular model kits and explaining the reason that different coloured balls had a different number of holes. Together we observed the colour coding of the atoms, their position on the Periodic Table, the number of holes drilled into the model atoms and the number of valence electrons they each had. Most students were very confused at this stage.
2.      Perform and Record
In pairs, the students found the correct coloured atoms to build one molecule of water and built it. It quickly became apparent that unless the oxygen atom was placed in the center the molecule could not exist. It was further observed that the molecule was “bent” or angled, and could not be a straight line.
I distributed the P.E.O.E. template to the students and had them predict how the look (shape, geometry) of an atom of H2O would change if one atom of oxygen was added, making H2O2. When asked to make this prediction on paper most students just drew an oxygen atom to the oxygen atom that was central to the water molecule.  They did not take into account that there were insufficient valence electrons to make this possible. This concept appears to be too abstract for these learners at this stage of their academic career. 
Once the students had completed box 2 of their P.E.O.E. template they were then instructed to build the H2O2 molecule. When given the hands-on model to build they immediately realized that their predictions were incorrect, took their water molecule apart and constructed the correct molecule for H2O2. 

3.      Analyze and Interpret
When the students compared their models of water to that of hydrogen peroxide they were able to contrast their shapes (bent vs. straight line)
.4.      Communicating
Students used the PE.O.E.  to communicate what they had learned about the relationship between the chemical formula and the look of the molecule. They went on to build a number of various molecules. Initially I supplied them with a list of chemical formulas to build and draw. Subsequently they built molecules ad hoc and determined their chemical formulas. Lots of authentic learning occurred, everyone had fun and my learning outcomes were achieved.
What learning outcomes?
From Strand A of our Ministry document – Scientific Skills and Investigation we demonstrated scientific investigation skills (related to both inquiry and research) in the four areas of skills (initiating and planning, performing and recording, analysing and interpreting, and communicating) (A1). We also selected appropriate instruments and materials for particular inquiries (A1.2). And from the Chemistry unit we demonstrated an understanding of the properties of common elements and simple compounds, and general features of the organization of the periodic table (C3). 
What strategies do you use to help these learners understand that importance of chemical bonding in molecular geometry?