Monday, October 25, 2010

Static Electricity – Creating an Electrostatic Series -- Posting five


I have been re-energized by attending a Smarter Science symposium over the weekend so today I facilitated an inquiry-based collaborative learning experience into electrostatic series with my grade nine applied class.
1. 1. Initiate and plan – ENGAGE
I began the class by modeling how a balloon holding static charge can be used to pick up pieces of confetti (the holes collected out of my hole-puncher). We drew on our previous knowledge, from last week’s classes, to determine how the balloon could be charged with static electricity.
I told the students that we were going to do an investigation to determine what material would produce the greatest static charge on the balloon. In the middle of the sun burst diagram we wrote: “What type of material will make the most static electricity?” This was our dependent variable.
We used the sun burst diagram to list all the different things that could observed while doing a lab.
These were:
1. The time spent rubbing
2. The type of rubbing
3. The shape of the balloon
4. The size of the balloon
5. The colour of the balloon
These items were listed on to little post it notes and stuck around the rays of the sun burst diagram.
We moved to page two of the sun burst diagram, to the Initiate and plan page, which has a picture of the brain and says “brainstorming” on in. Here we decided how we would control the variables that we had listed on our post it notes. This could have been done group-by-group but I chose to do it as a large group activity so everyone would be controlling variable in the same manner. Several excellent suggestions were made so we voted to decide which ones to go with. For example, the amount of time spent rubbing could have been 30 seconds, 60 seconds, 90 seconds, etc. All were good choices so I narrowed it down to the first four suggestions and we voted, by a show of hands. Thus, the controls were determined to be:
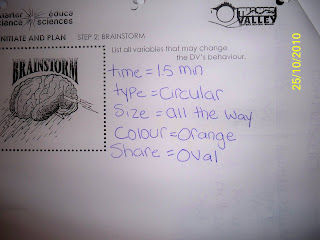
1. Time rubbing = 1.5 minutes
2. Type of rubbing = circular motion
3. Size of balloon = full capacity
4. Colour = orange (that’s what I had the most of)
5. Shape of balloon = oval
Now we moved all of our post it notes over to the fish bone diagram where they were taped down. I had actually forgotten that we should tape them down at this point but the kids quickly reminded me.
2. Perform and Record = EXPLORE
The students designed an observation table by drawing a simple t-chart. On the left side they wrote “type of material” and on the right side they wrote ‘number of pieces of confetti collected”. Working in pairs they performed the investigation and were incredibly intr4igued by it. It made me realize how much of the sense of wonder grade nine students still have in them.
Some of the comments I heard during the lab were:
“I can hear the static electricity!”
“Listen!”
“You can hear it crackling!”
“Don’t forget to discharge between tests.”
“Make sure you rub in little circles.”
“It’s your turn to time while I rub.”
“Let’s split the amount of confetti pieces we have to count and each count half of them then add our two answers together.”
3. Analyze and Interpret = EXPLAIN
After testing a variety of materials, such as wool, silk, hair, fur and plastic the students were able to analyze their data to determine which materials created the most static and which created the least. At this stage I introduced them to the concept of “Electrostatic Series” with a very simple definition of “ a list of materials from the most static to the least static”.

4. Communicate = EXTEND
Each student created an electrostatic series by listing the materials they tested, in order, from those that created a static charge to those that created the least. They were able to quantify their results because they had counted the number of pieces of confetti that was attracted to the balloon during each test.

Saturday, October 2, 2010

Cleaning Up Oil Spills – Major Lab Investigation for Grade 9 Applied Science Ecology Unit -- Week Four

1. Initiate and Plan = ENGAGE
Day One
In a large group the topic of the major oil spill in the Gulf of Mexico was discussed. Most students were aware that there had been an oil spill somewhere at some time but little else was known about it. (Too far away, too abstract, no connection to us.) In order to prod some concern about it I referred to a food chain which contained fish and has humans as the top carnivore. A “thumbs up – thumbs down” was done to survey how many of the students ever eat fish. A majority do.
An overhead photograph was projected onto the screen showing the extent of the oil along the southern US coast during the summer of 2010.. The question was posed: “Would you want to eat a fish that had been in an oil spill? “Eww Gross! No way!” Now they were interested!
Although it is my policy not to assign homework to this class (since they are not going to do it and it only stresses me out) I told them they were talk to their parents or goggle ideas of how an oil spill could be cleaned up. Don’t write anything down, just collect ideas. (Questioning, Interviewing, Searching)

Day Two
Students were asked what ideas they had learned about ways to clean up an oil spill. Not surprisingly only three students had actually pursued the research and of them only one had come up with an idea which was “use ropes of human hair”. Still it was a start.
On the projector we went to “Goggle Images” and Goggled “Cleaning up oil spill”. I chose to use images since these students are reluctant readers who are very capable of extracting information from pictures. (Searching, Observing) One student was our scribe to keep track of the ideas we could find through our research, she was instructed to just jot down one word for each idea – no details. In about 10 minutes our list looked like this:
Hair
Sawdust
Hay
Wax
Diapers
Kitty litter
Cattail fluff
Filtering

Day Three
Instead of modeling how we could possible use any of these items to clean up oil We used “Google Videos” to watch a couple of videos which showed how these various items were used to clean up oil. (Searching, Observing)
2. Perform and Record (EXPLORE)
Still day three!
The class was broken into small groups and each group took the responsibility of testing two of the substances listed above. This allowed some substances to be tested more than once. The students were not given any instructions on what procedure to follow. A counter was set up with what I felt was a reasonable amount of equipment and apparatus and each group had to decide for themselves what to do. The only thing I insisted on was conformation to our lab safety rules, ie. Wear goggles and tie back you hair. Group members were not assigned specific roles. This allowed me to observe who were the natural leaders, followers, and do-nothings.
Group dynamics were quickly established and amazing tests were carried out. (Planning, Designing, Constructing, Experimenting)

3. Analyze and Interpret (EXPLAIN)
Prior to clean up, the students were instructed to walk around the lab and look at what each of the other groups had done. They were provided with post it notes and told to rate the ability of each substance to clean up an oil spill on a scale of I to 10, with 1 being the worst and 10 being so good you would feel comfortable drinking the water that remained. (Gathering Data, Recording, Comparing, Contrasting, Analyzing, Evaluating, Reviewing)


4. Communicate (EXTEND)
The overwhelming consensus amongst the students was that cattail fluff was the best substance to use to clean up an oil spill! (Discussing, Reporting, Reflecting)

DAY FOUR
Back to Initiate and Plan (ENGAGE)
Now it was time for a controlled experiment. We used the Smarter Science starburst diagram to determine what we could measure and control in a repetition of yesterday’s experiment. A large poster of the diagram was put on the board and each student was provided with post it notes and an individual copy of the diagram. The class was asked: “What could we have measured in yesterday’s experiment?” A list of items was quickly brainstormed, each item recorded on a post it note and stuck on the rays of the starburst diagram. The list was:
How much oil was added?
How much water was added?
What size basin was used?
How much stirring was done?
How much of the substance was added?
How long were all the materials in contact?
How much oil was removed?
The students quickly decided that the final question,”How much oil was removed?” was the one variable they could not control and it would be the one they tested for.
Armed with this information we worked in small groups to design a second experiment which would allow us to quantify our results. Each group designed an experiment where all materials were carefully measured. By the end of class they all had a detailed list of materials and apparatus as well as a written procedure ready for the next day! (Questioning, Predicting, Hypothesizing, Planning,
Designing)
DAY FIVE
Back to Perform and Record (EXPLORE), Analyze and Interpret (EXPLORE AND EXPLAIN) and Communicate (EXTEND)
Today was a culmination of a week of an exciting and dynamic investigation. Students rushed to class early. They didn’t want to wait for me to take attendance, they were so eager to get to work!
Each group worked in a safe and efficient manner to create their oil spills and subsequently clean them up with the cattail fluff. It didn’t take long to realize a major source of error with our plans was that we couldn’t measure the amount of oil soaked up by the cattail fluff since it could not be squeezed out of the cattail fluff, as previously predicted. None the less the students declared the experiment a huge success.
They were in the midst of cleaning up when the class clown declared we should set the oil soaked cattail fluff on fire! This idea rippled around the room as quick as a wink. As it was discussed and joked about it was refined.
“We can’t light it on fire in here --- it would burn the school down!”
“Won’t it be too wet to light?”
“Did they try lighting the oil in the Gulf on fire?”
“Wouldn’t burning it make a lot of air pollution?”
“Would it stink?”
“Maybe it would just blow up.”
“But I have asthma....”
My teachable moment had arrived!
With very little prompting, the first group to finish cleaning quickly got on their itouches and learned that in fact 25% of the oil spilled into the Gulf was burnt off! They showed each other pictures of the dark plumes of smoke created by such a fire.
Once order was restored I told the class how proud I was of their work this week. (Was it work?!) We made a plan. The oil soaked cattail fluff was set to dry in the green house. The next time I have a supply teacher, if I get a good note about the class we are going to sneak out the back of the school and attempt to light the fluff on fire! (Please don’t call my principal!)
As a final activity for the week the students were asked to complete an exit ticket. On post it notes they had to write down one question that they were left wondering about oil spills. Some sample questions they wrote are:
I wonder what happened to the fish.
Will it really burn?
How was the real oil spill cleaned up?
What about the birds?
How did it happen?
Another successful week with the grade nines. Science is fun!

Watch the videos below to see how engaged the students are!